
![]()
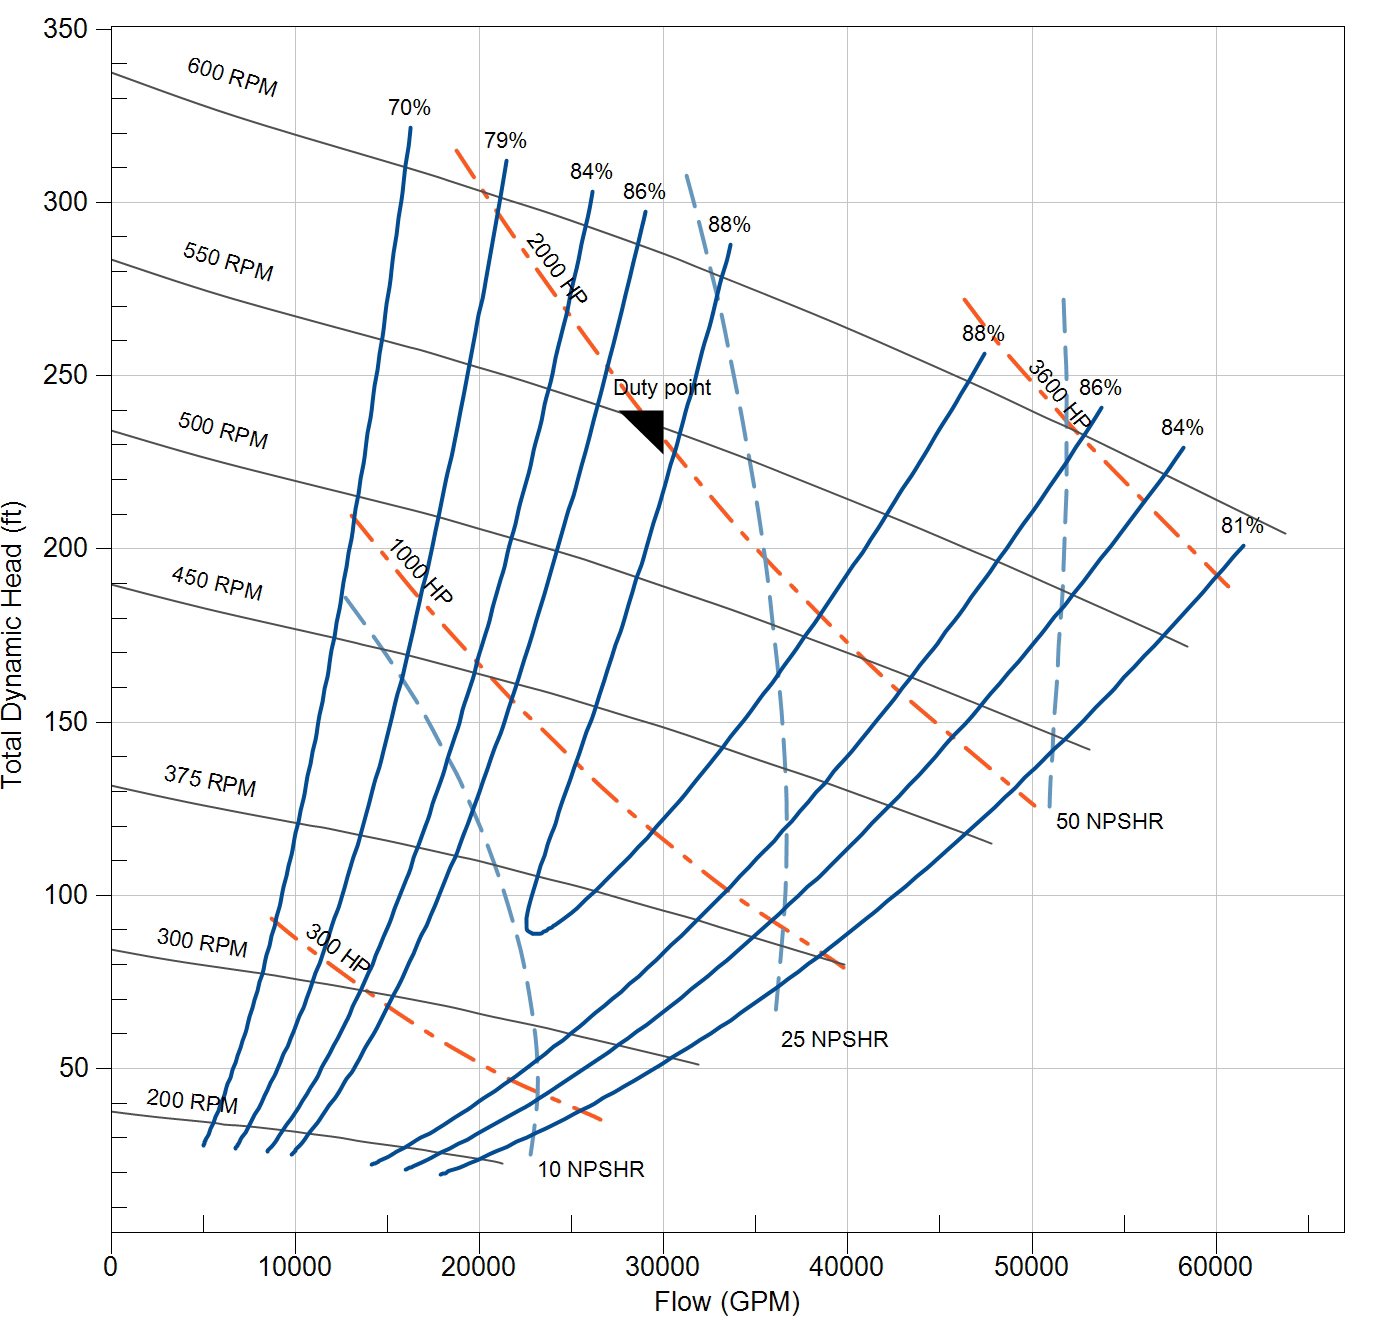
The pump performance chart above is a graphical representation of performance for a particular pump. By using this chart, you can see the head, or pressure, that the pump produces at various flow rates and at different speeds. For example, at 560 RPM, the pump will produce 240 feet of head at 30,000 gallons per minute.
If you want to calculate pump performance without a chart — or you want to calculate a value that the chart doesn’t show — you can accurately do so by using the formulas called the Affinity Laws.
For any pump, you can predict nearly any performance characteristic by using the formulas you see below.
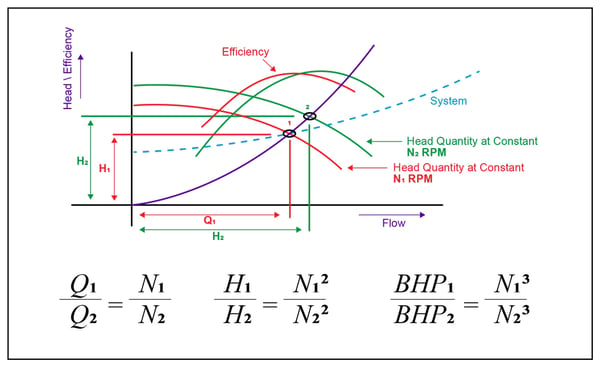
To use the formulas, you need to remember these simple rules:
- Flow varies directly as the speed or diameter change.
- Head varies as the square of the speed or diameter change.
- Power varies as the cube of the speed or diameter change.
- Performance varies along a line of constant efficiency NOT along the system curve.
For example, let’s say that we know the pump in the example above is operating at 560 RPM and produces 240 feet of head at 30,000 gallons per minute. We want to know what the performance is at 475 RPM.
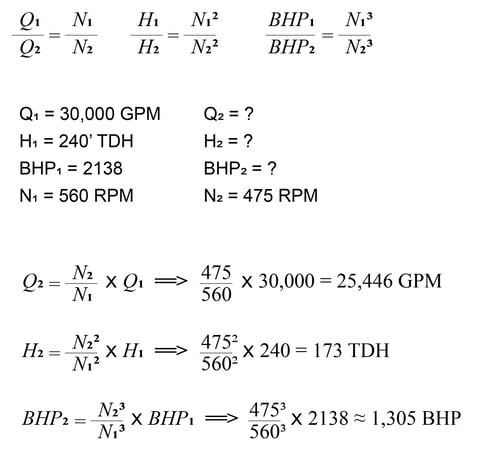
Thus, in this example, we can predict that at 475 RPM, the pump will produce 173 feet of head at 25,466 gallons per minute.
We can also use the Affinity Laws to predict how pump performance will change when the impeller diameter changes.
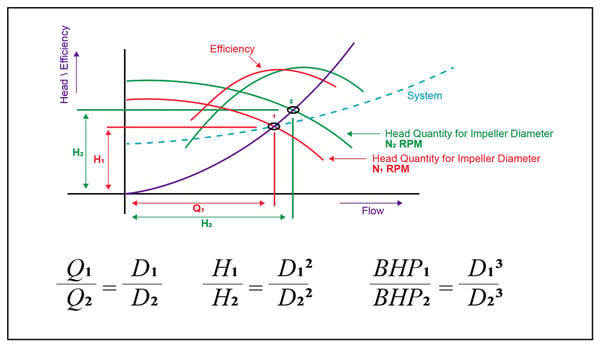
With these formulas, you can predict the performance of the pump by substituting the diameter for the speed. Thus, if we double the diameter of the impeller, we double the flow and the head increases by a factor of four.
In the lab, once we establish the performance of a pump, we measure and generate a few single-speed test curves. Using the Affinity Laws, we then can generate the full performance chart at different speeds.
Affinity Laws lets us accurately predict pump performance without having to perform endless tests on every pump.